Using Infographics to Go Public with SoTL
By Bryn Keogh, Lorelli Nowell, Eleftheria Laios, Lisa McKendrick-Calder, Whitney Lucas Molitor, Kerry Wilbur
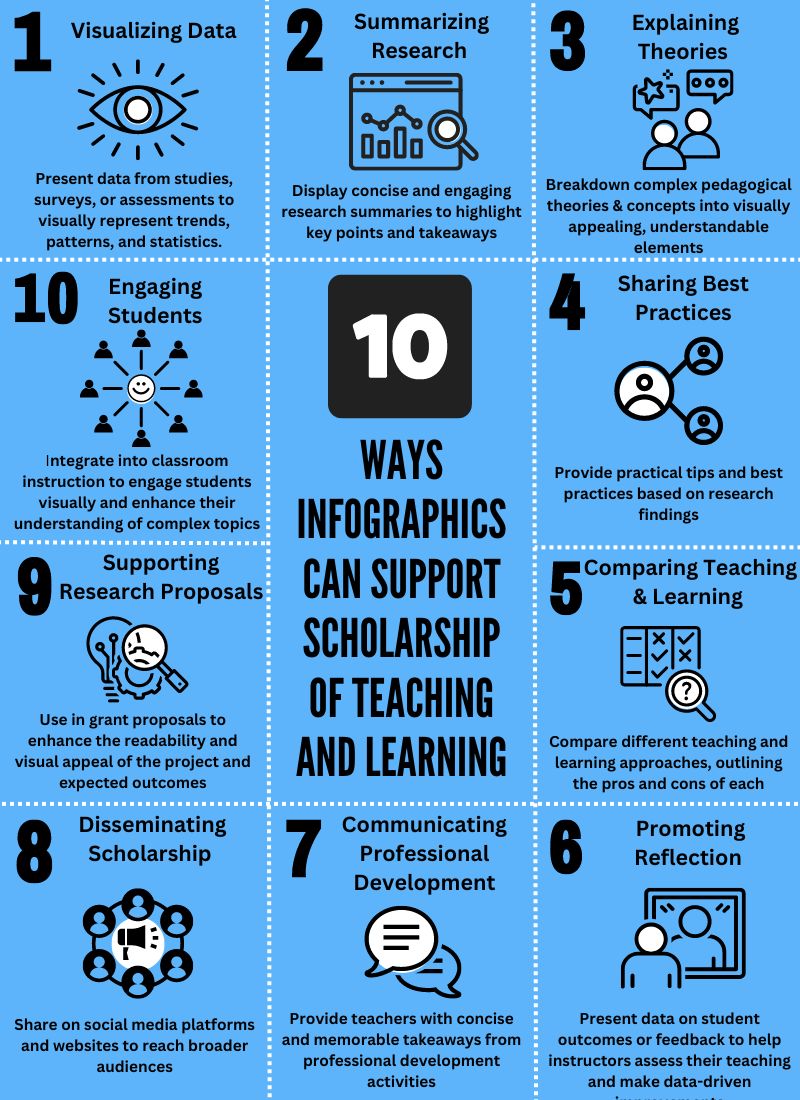
The 2022 International Collaborative Writing Group (ICWG-22) of the International Society for the Scholarship of Teaching and Learning (ISSOTL), brought us, a group of interdisciplinary healthcare scholars, together, and challenged us to take SoTL public. Through our collaboration, we identified infographics as a potential way to communicate SoTL to diverse audiences in visually appealing and easily understandable ways. As part of our work, we created a SoTL-informed infographic for public consumption. In our recent publication titled Using Infographics to Go Public with SoTL, we share our experiences, outline best practices in infographic development, provide some infographic exemplars, and highlight 10 ways infographics can be used to advance the field of SoTL:
- Visualising data from SoTL studies to share trends, patterns, and statistical information in an easily digestible way.
- Summarizing SoTL research in concise ways that highlight key points and takeaways.
- Explaining SoTL concepts and theories by breaking them down into visually appealing, easy-to-understand elements.
- Sharing SoTL best practices and tips based on research findings.
- Comparing teaching and learning approaches outlining the pros and cons of each clearly and straightforwardly.
- Promoting reflective teaching by presenting data on student outcomes or feedback in a visual format to help make data-driven improvements.
- Communicating professional development in SoTL workshops, conferences, or training sessions to provide teachers with concise and memorable takeaways from professional development activities.
- Disseminating SoTL on social media platforms and websites to reach broader audiences, including educators, students, and the public.
- Supporting SoTL research proposals by including infographics in grant proposals to enhance the readability and visual appeal of the SoTL project and expected outcomes.
- Engaging students by integrating infographics into classroom instruction to enhance their understanding of complex topics.
Read the TLI article here.


